YON's Volume Rendering Page
<> Emissive Clipping Planes (SIGGRAPH 2003)
<> fMRI Visualization of Multiple Functional Areas
<> YON - Jan C. Hardenbergh
Integrated 3D Visualization of fMRI and DTI tractography
A Poster presented at Visualization 2005
This document contains all of the text and most of the pictures was used for the 60x40 inch poster. However, the images are of lower resolution. This is very close to the Poster Abstract on the DVD.(poster at 2400x1600).
|

|
Jan Hardenbergh
TeraRecon, Inc.
jch@terarecon.com
|
Bradley R. Buchbinder
Neuroradiology
MGH Dept. of Radiology
and Harvard Medical School
|
Shirley A. M. Thurston
3D Imaging Service
Dept. of Radiology
Massachusetts General Hospital
|
Jonathan W. Lombardi
3D Imaging Service
Dept. of Radiology
Massachusetts General Hospital
|
Gordon J. Harris
3D Imaging Service
Dept. of Radiology
Massachusetts General Hospital
|

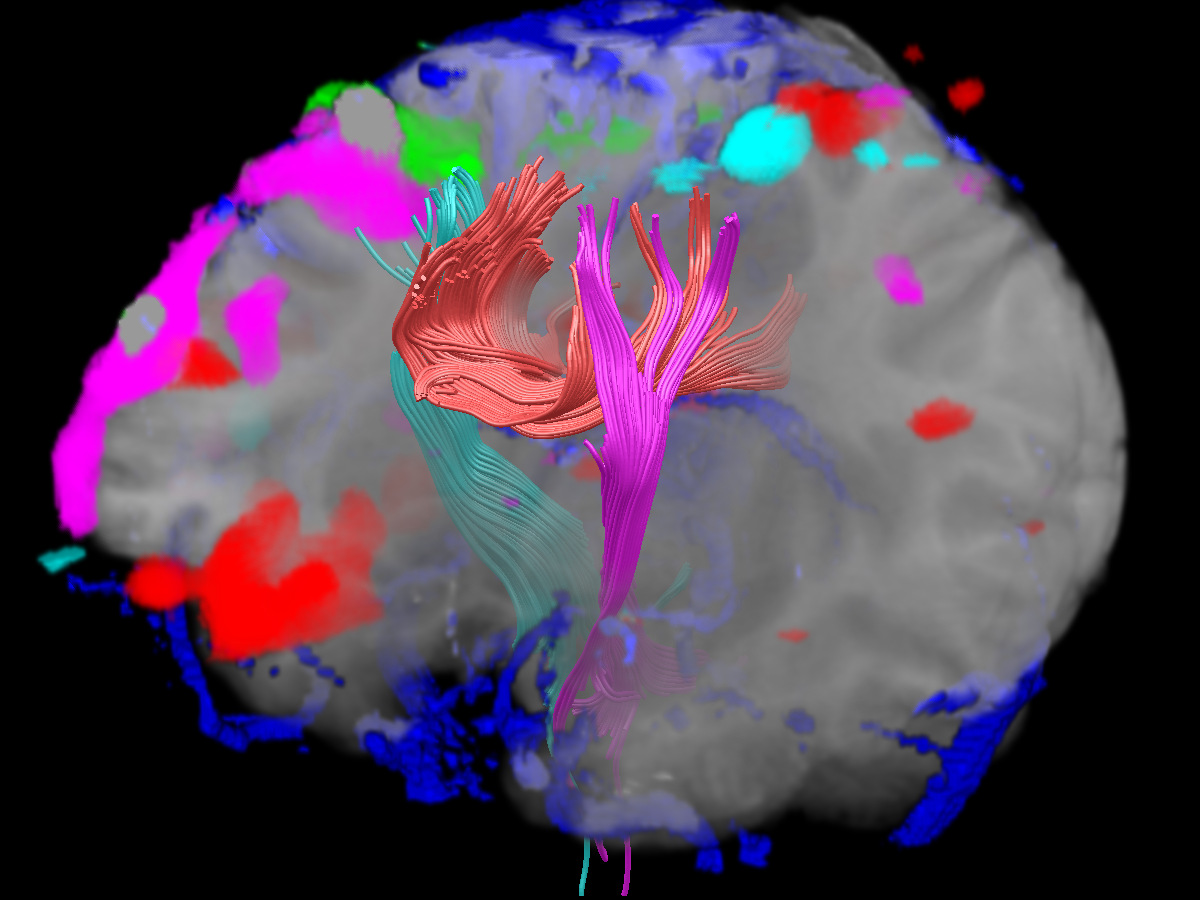
Figure 1. This overview image displays the 3D streamlines representing the DTI tracks, several functional areas, the vasculature and the underlying anatomy clipped at an oblique angle. The focus of this poster is the addition of the track geometry to an existing fMRI visualization application. On the right we can see the cortical spinal track (cyan) projecting from the left hand motor region (green).
INTRODUCTION
Neurosurgeons seek a balance between maximizing surgical benefit while minimizing surgical risk. One of the main determinants of risk is the proximity of surgery to critical areas of the cerebral cortex, such as those serving motor, somatosensory, language, and visual functions. Functional MRI (fMRI) is capable of localizing such critical cortical areas and can thereby reduce the risk of their inadvertent injury. However, it is equally important to avoid transection of the axons which connect these cortical areas to other parts of the brain and spinal cord. The axons form dense fiber tracts within the white matter; the functional architecture of these fiber tracts is not discernible by conventional structural MRI or fMRI. However, another recent MRI technique, diffusion tensor imaging (DTI) and tractography, has proven capable of modeling fiber architecture within the white matter. Thus, presurgical brain mapping presents the challenge of integrating and visualizing multiple representations of brain anatomy, including functional cortical areas, functional white matter tracts, and their underlying structural anatomic substrate. We have previously presented work describing a tool for integrated volume visualization of fMRI and conventional structural MRI [1]. The object of the present work is to extend this tool to further incorporate white matter fiber track geometry. Visualization issues that we consider include the mixing of voxel-based and geometry data, volume rendering techniques, graphics hardware techniques, and user interface design.
fMRI BACKGROUND
Functional MRI detects alterations in cerebral blood flow and oxygen metabolism that co-localize with neural activation. fMRI images are acquired while the patient performs specified cognitive or behavioral tasks in the MRI scanner. Our fMRI presurgical planning studies activate and localize sensorimotor and language regions. Prior to visualization, the fMRI and structural datasets are co-registered. fMRI processing is performed on a Linux workstation using MEDx. For each task paradigm, the fMRI analysis yields a volume of activated voxels that is subsequently passed to the visualization tool.
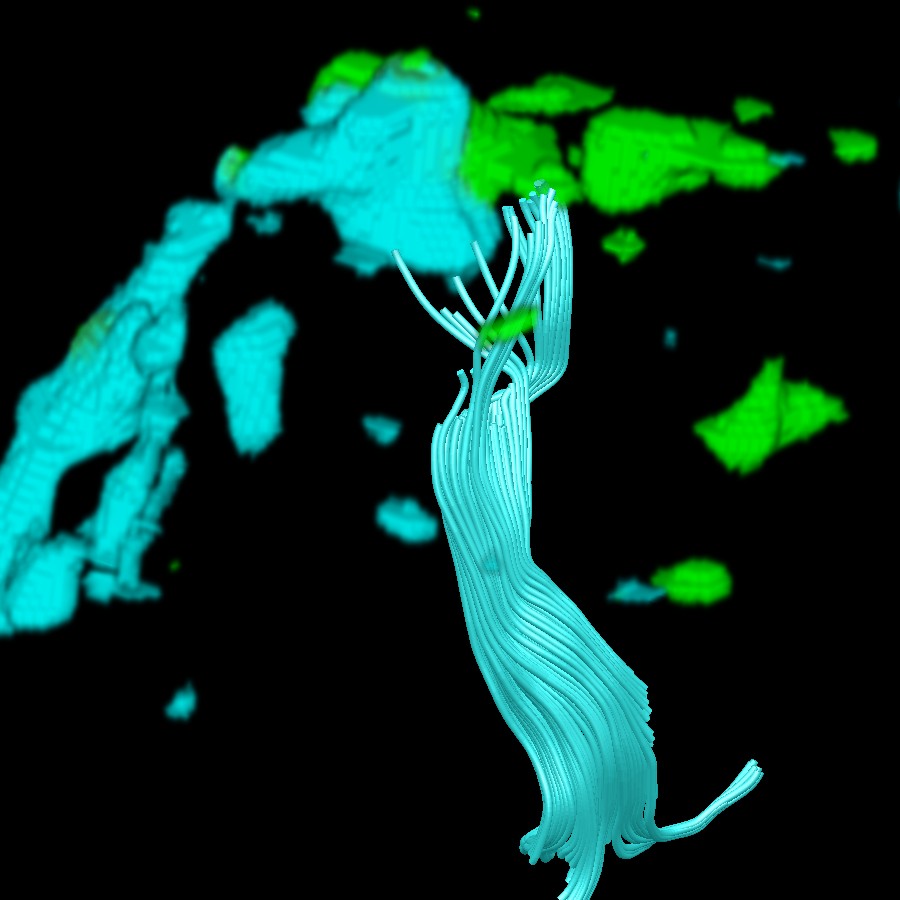
Figure 2. An uncluttered view of the cortical spinal tract (cyan) projecting from the left hand motor region (green).
DTI BACKGROUND
DTI exploits the anisotropic nature of water diffusion in highly structured media like white matter to estimate the principal orientation of fibers within each voxel [2]. Water molecules diffuse most readily parallel to the fibers; axon membranes and their surrounding myelin sheaths act as barriers to diffusion across the fibers. Therefore, the direction of greatest water mobility may be identified with the principal fiber orientation. At each voxel throughout the brain, the anisotropy is characterized by a diffusion tensor, and the direction of greatest diffusibility is determined by its principal eigenvector. DTI yields a discrete sampling of the diffusion tensor field throughout the brain. Mapping of the principal fiber orientations involves a reduction of the tensor field to a vector field consisting of the principal eigenvector at each voxel. The fiber tracts coursing through the white matter are modeled by streamlines of this vector field. The process of generating white matter fiber paths from DTI data is tractography. Many functional white matter tracts have been anatomically defined. Several relatively large and surgically important functional tracts can be modeled by DTI tractography, including the corticospinal and corticobulbar tracts (motor pathways), arcuate fasciculus (language pathways), optic radiations (visual pathways), and callosal projections (interhemispheric pathways).
We generate DTI fiber tracks on a Siemens Leonardo workstation using a DTI task card [3]. Seed points are defined within regions of interest, guided by known anatomy. Tracks are generated bidirectionally from each seed point by a numerical integration procedure subject to constraints that filter out divergent paths related to noise, finite spatial resolution, and fiber crossings. The tractography procedure yields a set of coregistered fiber tracks, each in the form of a linear curve specified by 3D coordinates. These curves are subsequently passed to the visualization tool, which visualizes the curves in the same manner as a diffusion tensor field [5].

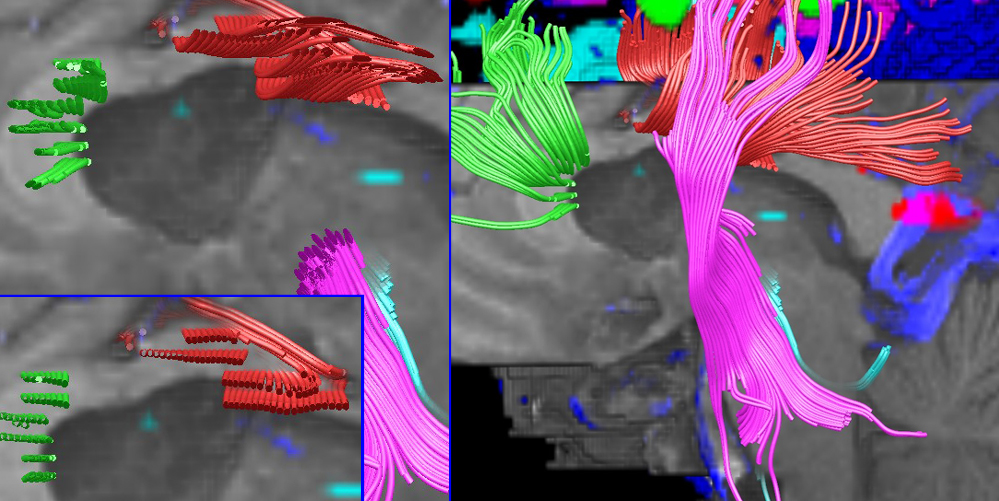
Figure 3. Adjusting geometry clip plane in relation to the voxel clipping plane.
VISUALIZATION APPLICATION
The visualization tool integrates the volume data and tractography geometry data. The voxel imaging data is rendered with a high quality and high performance volume rendering engine. The track geometry is rendered as 3D streamlines. This uses the optimal technique for each representation as they are equally important to the task.
The application is capable of rendering multiple color-encoded functional activation volumes and fiber tract bundles. The user interface allows individual volumes and tracts to be switched on or off, allowing various comparisons and degrees of visual complexity.
A voxel clipping plane allows flexible visualization of select brain regions. The clipping plane may be rotated and translated arbitrarily and the entire visualization volume may be rotated and scaled arbitrarily. Ease of use for rotating and zooming the object, changing transparency, and rotating and pushing the clipping planes are critical to the UI.
The clipping plane can be applied to the geometry in an adjustable manner, or not at all. Changing the offset between the voxel clip plane and the geometry clip plane allows the user to follow the tracts from the voxel clipping plane into the surrounding white matter. The visualization tool facilitates interactive exploration by the neuroradiologist and neurosurgeon, clarifying important functional and structural anatomic relationships within the brain for optimal planning of the surgical approach.
The visualization application runs on a Linux workstation equipped with a TeraRecon VolumePro 1000 3D volume rendering engine [6]. The 3D streamlines are based on 3d paths from the DTI Task Card saved as .trk files and read by the TrackIO utility. The GLE Extrusion Library and OpenGL are used to create the 3D streamline geometry. The VolumePro 1000 uses the depth buffer created while rendering the geometry to stop rays as they are being cast. This allows for precise generation and compositing of the voxel and geometry data.
REFERENCE
[1] Jan Hardenbergh, "fMRI Visualization of Multiple Functional Areas", SIGGRAPH 2004 Poster. https://www.jch.com/volumes/fmriviz.htm
[2] P. J. Basser, S. Pajevic, C. Pierpaoli, J. Duda, and A. Aldroubi (2000) In vivo fiber tractography using DT-MRI data, Magn Reson Med 44, 625-32.
[3] DTI Task Card (Athinoula A. Martinos Center for Biomedical Imaging, Massachusetts General Hospital, Harvard-MIT Division of Health Sciences and Technology, Boston)
http://www.nmr.mgh.harvard.edu/~rpwang/siemens/dti_taskcard/
[4] Nimsky, Christopher M.D, Ganslandt, Oliver M.D, Hastreiter, Peter Ph.D.; Wang, Ruopeng Ph.D.; Benner, Thomas Ph.D.; Sorensen, A Gregory M.D.; Fahlbusch, Rudolf M.D., Preoperative and Intraoperative Diffusion Tensor Imaging-based Fiber Tracking in Glioma Surgery. Neurosurgery. 56(1):130-138, January 2005.
[5] Song Zhang, Charles T. Curry, Daniel S. Morris, and David H. Laidlaw. Visualizing Diffusion Tensor MR Images Using Streamtubes and Streamsurfaces. In Human Brain Project annual meeting, NIH,Bethesda,MD, May 2000.
[6] Wu, Y., Bhatia, V., Lauer, H., Seiler, L. 2003. Shear-image ray casting volume rendering. In Proceedings of the 2003 symposium on Interactive 3D graphics, ACM Press.
draft images
YON's Volume Rendering Page
<> fMRI Visualization of Multiple Functional Areas
<> Emissive Clipping Planes (SIGGRAPH 2003)
<> YON - Jan C. Hardenbergh
last: 1-NOV-2005 <> P.S. Got kids with big questions? See YIAMUU